Creating Custom Template
In some cases you would like to create your own custom template. Basically, what you need to do is to inherit one of the predifined templates and to override some properties.
Org Chart JS visual components
You can change the look and feel of the following Org Chart JS components.
- Node
- Fields
- Image
- Link
- Node menu button
- Expand/Collapse button
- Menu button
- Move icon
OrgChart.templates.myTemplate = Object.assign({}, OrgChart.templates.ana);
1. Node customization
If you want to change the color, shape or size of the node you have to define node and size
Here is an example:
     OrgChart.templates.myTemplate.size = [200, 200];
     OrgChart.templates.myTemplate.node =
                '<circle cx="100" cy="100" r="100" fill="#4D4D4D" stroke-width="1" stroke="#aeaeae"></circle>';
     OrgChart.templates.myTemplate.defs = '';
You will need to modify the ripple, color, radius and rect
     OrgChart.templates.myTemplate.ripple = {
        radius: 100,
        color: "#e6e6e6",
        rect: null
    };
Or you can disable the ripple
     OrgChart.templates.myTemplate.ripple = {
        radius: 0,
        color: "none",
        rect:null
    };
2. Field customization
To change the position of the fields define field_0 and field_1. You can define as many fields as you want
     OrgChart.templates.myTemplate.field_0 = '<text style="font-size: 24px;" fill="#ffffff" x="100" y="90" text-anchor="middle">{val}</text>';
     OrgChart.templates.myTemplate.field_1 = '<text style="font-size: 16px;" fill="#ffffff" x="100" y="60" text-anchor="middle">{val}</text>';
3. Image customization
To change the position of the image define img_0
     OrgChart.templates.myTemplate.img_0 =
        '<clipPath id="ulaImg">'
        + '<circle cx="100" cy="150" r="40"></circle>'
        + '</clipPath>'
        + '<image preserveAspectRatio="xMidYMid slice" clip-path="url(#ulaImg)" xlink:href="{val}" x="60" y="110" width="80" height="80">'
        + '</image>';
4. Link customization
To change the links between the nodes override link
     OrgChart.templates.myTemplate.link =
        '<path stroke="#686868" stroke-width="1px" fill="none" data-l-id="[{id}][{child-id}]" d="M{xa},{ya} C{xb},{yb} {xc},{yc} {xd},{yd}" />';
5. Node menu button customization
To change the position and the shape of the node menu button nodeMenuButton
     OrgChart.templates.myTemplate.nodeMenuButton =
        '<g style="cursor:pointer;" transform="matrix(1,0,0,1,93,15)" data-ctrl-n-menu-id="{id}">'
        + '<rect x="-4" y="-10" fill="#000000" fill-opacity="0" width="22" height="22">'
        + '</rect>'
        + '<line x1="0" y1="0" x2="0" y2="10" stroke-width="2" stroke="rgb(255, 202, 40)" />'
        + '<line x1="7" y1="0" x2="7" y2="10" stroke-width="2" stroke="rgb(255, 202, 40)" />'
        + '<line x1="14" y1="0" x2="14" y2="10" stroke-width="2" stroke="rgb(255, 202, 40)" />'
        + '</g>';
6. Expand/Collapse button customization
To change the shape and the color define plus and minus and expandCollapseSize
    OrgChart.templates.myTemplate.plus =
            '<rect x="0" y="0" width="36" height="36" rx="12" ry="12" fill="#2E2E2E" stroke="#aeaeae" stroke-width="1"></rect>'
        + '<line x1="4" y1="18" x2="32" y2="18" stroke-width="1" stroke="#aeaeae"></line>'
        + '<line x1="18" y1="4" x2="18" y2="32" stroke-width="1" stroke="#aeaeae"></line>'

    OrgChart.templates.myTemplate.minus =
            '<rect x="0" y="0" width="36" height="36" rx="12" ry="12" fill="#2E2E2E" stroke="#aeaeae" stroke-width="1"></rect>'
        + '<line x1="4" y1="18" x2="32" y2="18" stroke-width="1" stroke="#aeaeae"></line>'

    OrgChart.templates.myTemplate.expandCollapseSize = 36;
7. Menu button customization
To change the shape and the color define menuButton
     OrgChart.templates.myTemplate.menuButton =
        '<div style="position:absolute;right:{p}px;top:{p}px; width:40px;height:50px;cursor:pointer;" data-ctrl-menu="">'
        + '<hr style="background-color: rgb(255, 202, 40); height: 3px; border: none;">'
        + '<hr style="background-color: rgb(255, 202, 40); height: 3px; border: none;">'
        + '<hr style="background-color: rgb(255, 202, 40); height: 3px; border: none;">'
        + '</div>';
8. Move icon customization
To change the tree move icon define pointer
     OrgChart.templates.myTemplate.pointer =
        '<g data-pointer="pointer" transform="matrix(0,0,0,0,100,100)">><g transform="matrix(0.3,0,0,0.3,-17,-17)">'
        + '<polygon fill="rgb(255, 202, 40)" points="53.004,173.004 53.004,66.996 0,120" />'
        + '<polygon fill="rgb(255, 202, 40)" points="186.996,66.996 186.996,173.004 240,120" />'
        + '<polygon fill="rgb(255, 202, 40)" points="66.996,53.004 173.004,53.004 120,0" />'
        + '<polygon fill="rgb(255, 202, 40)" points="120,240 173.004,186.996 66.996,186.996" />'
        + '<circle fill="rgb(255, 202, 40)" cx="120" cy="120" r="30" />'
        + '</g></g>';
Voila, here is the result:
9. Other examples:
You can rotate the text using transform.
     OrgChart.templates.myTemplate.field_0 =
        '<text width="230" transform="translate(300, -70) rotate(90)" style="font-size: 18px;" fill="#fff" x="125" y="95" text-anchor="middle">{val}</text>';
If you have any difficulties to create a template, please contact us, we will create a template that matches your project design for FREE.
Code demo on how to create multiple charts in one page with different template defs.
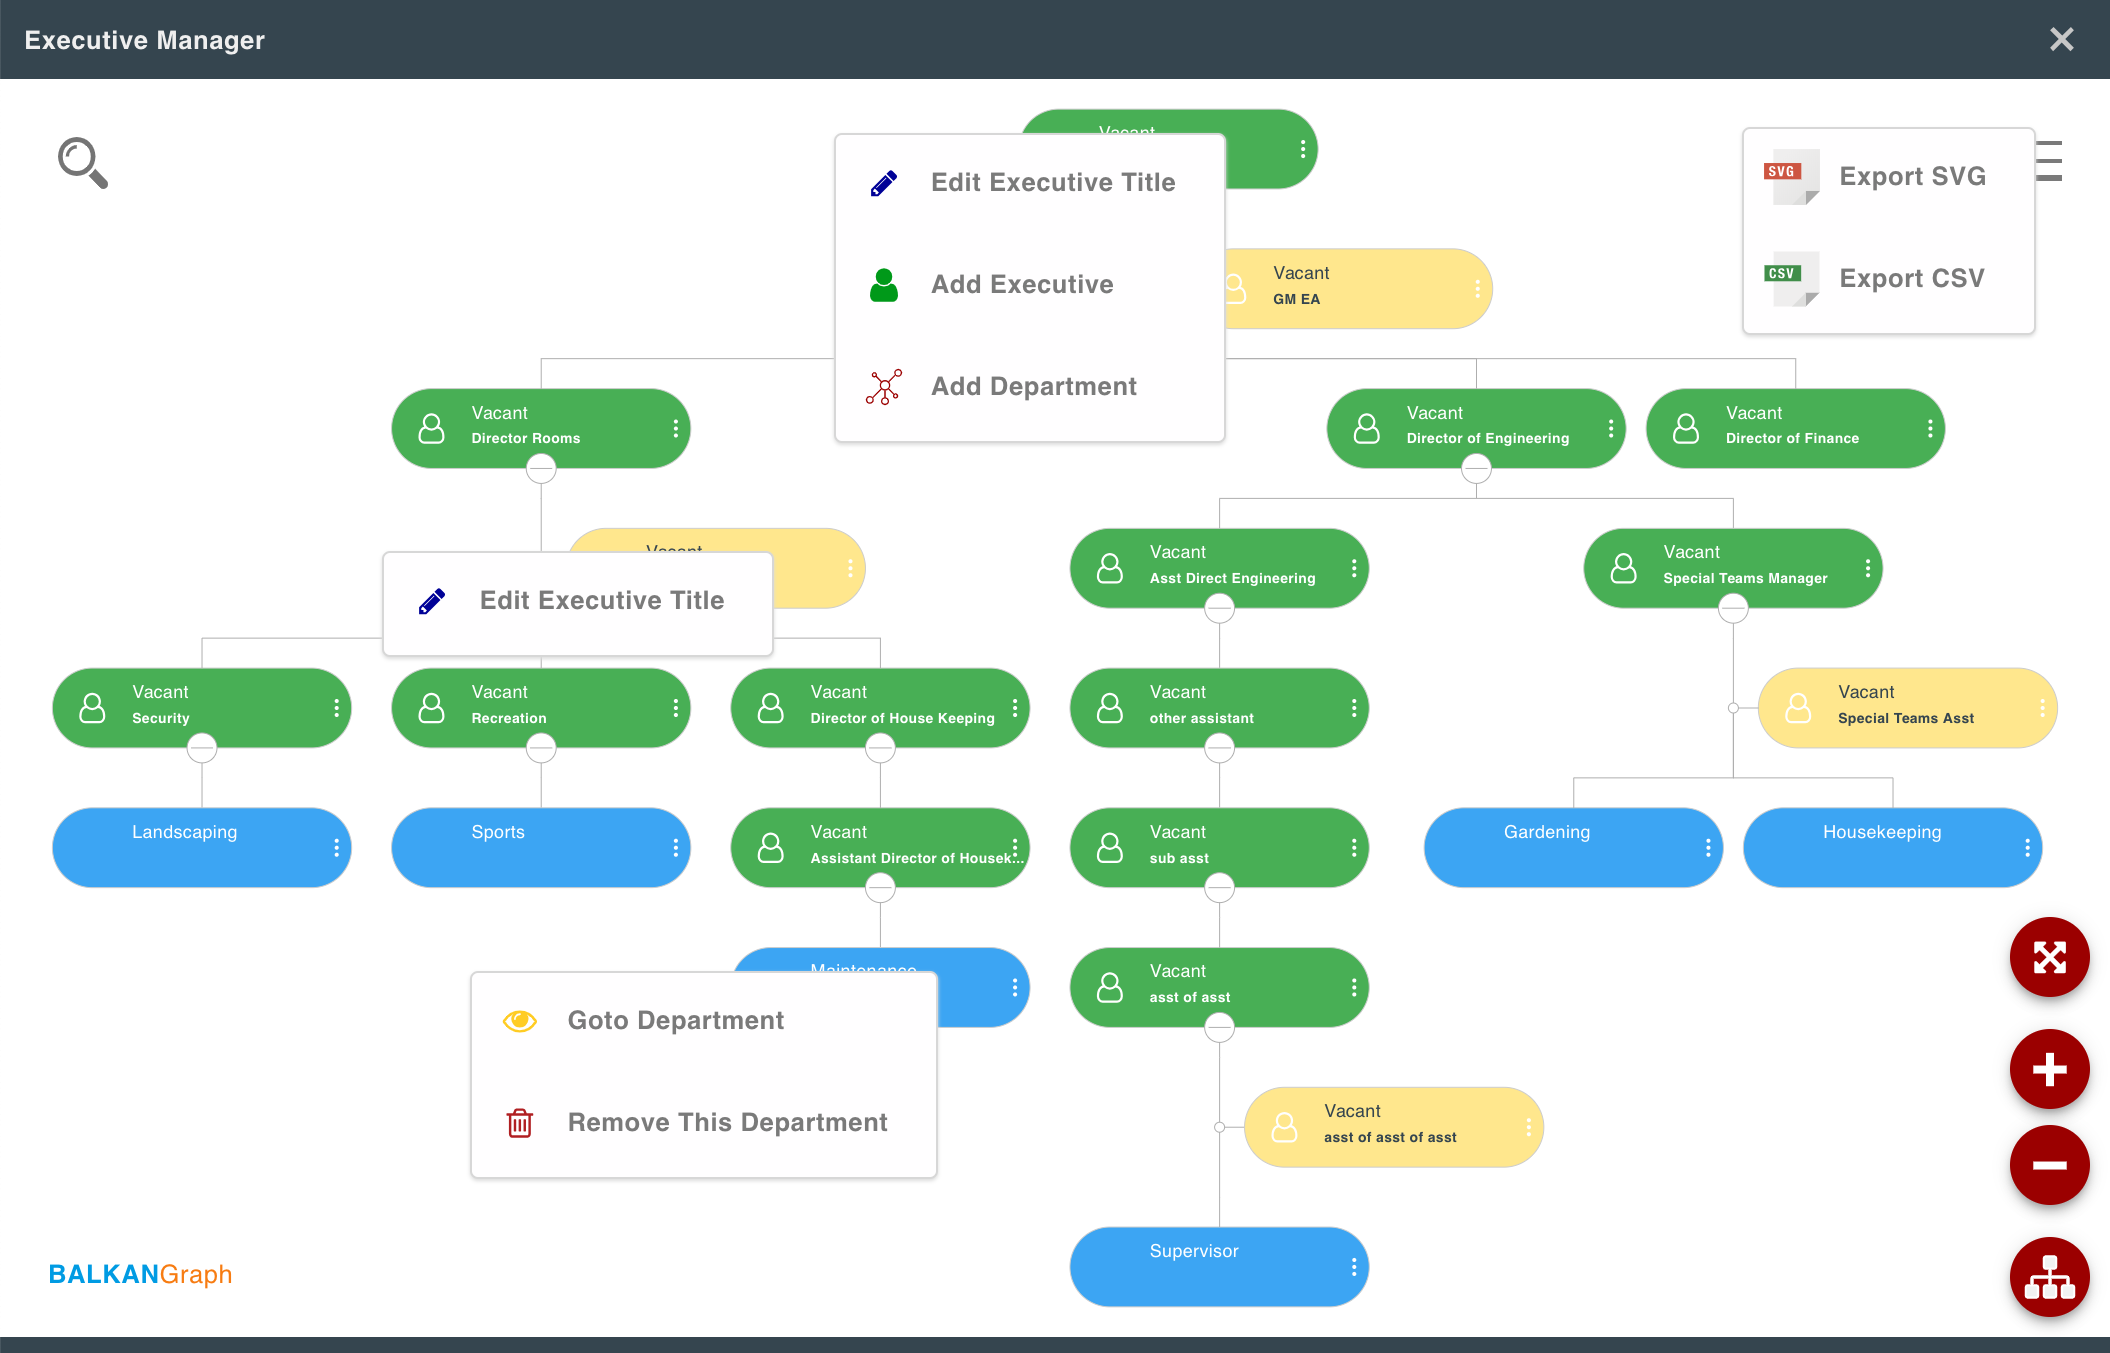
Below is a screenshot, provided to us by a client, that demonstrates how customizable is OrgChart JS.
Here you can find some of our customer's templates.
We would be happy if you share your template with us. Please send it as jsfiddle or an html file to support@balkan.app