Edit
Open Edit Form
The Edit Form can be opened from the node menu, node click event, setting an option called nodeMouseClick or simply calling chart.nodeUI.show method. Here is an example that demosntrates how to open the Edit Form with nodeMenu:
    var chart = new OrgChart(document.getElementById("tree"), {
            nodeMenu:{
                details: {text:"Details"},
                edit: {text:"Edit"},
                add: {text:"Add"},
                remove: {text:"Remove"}
            },
        ...
    });
Open the Edit Form from node click event:
    var chart = new OrgChart(document.getElementById("tree"), {
        ...
    });
    chart.on('click', function(sender, args){
        sender.editUI.show(args.node.id, false);
        // sender.editUI.show(args.node.id, true);  details mode
        return false; //to cansel the click event
    });
nodeMouseClick option values:
   var chart = new OrgChart(document.getElementById("tree"), {
            nodeMouseClick: OrgChart.action.edit, // edit mode
            //nodeMouseClick: OrgChart.action.details, // details mode
            //nodeMouseClick: OrgChart.action.none, // prevent opening
    });
As you can see the Edit Form can be opened in two modes, edit mode and details mode, the details mode is read only and it is useful when the user has read only permissions. If you want the edit button in the Edit Form to be disabled set editForm.readOnly option to true:
   var chart = new OrgChart(document.getElementById("tree"), {
            editForm: {readOnly: true}
            ...
   });
Configure Edit Form
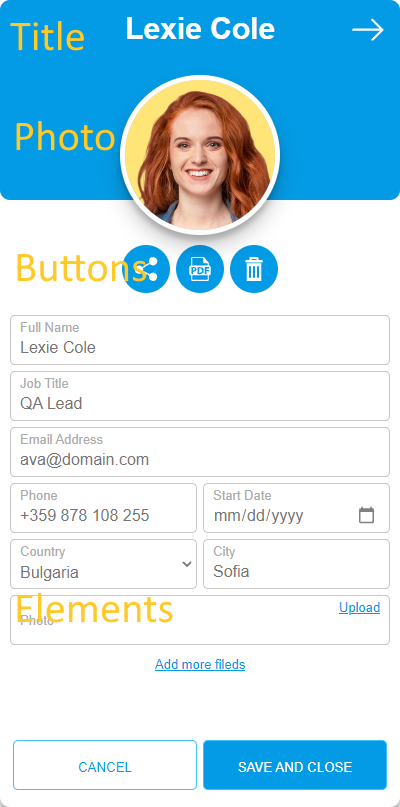
The Edit Form is fully configurable and consists of the following components, Title, Photo, Buttons, Elements(inputs) and add "Add More Fields". You can bind Title, Photo and Elements to your json data. Lets assume you have the folloing json data:
    var jsonData = [{ id: 1, Name: "John Smith", ImgUrl: "https://cdn.balkan.app/shared/anim/1.gif"}]
    var  chart = new OrgChart(document.getElementById("tree"), {
        editForm: {titleBinding: "Name", photoBinding: "ImgUrl"}
    });
    chart.load(jsonData);
Org Chart JS will display "Name" as Title and "ImgUrl" as Photo and "Name" and "ImgUrl" input Elements will be auto generated. If you want to change the labels of the auto generated input Elements set generateElementsFromFields option to false and bind input Elements to your data. You can add only the elements that you'd like to show. The below example will hide the photo link:
    var chart = new OrgChart(document.getElementById("tree"), {
        editForm: {
            generateElementsFromFields: false,
            elements: [
                { type: 'textbox', label: 'Full Name', binding: 'Name' },
                { type: 'textbox', label: 'Phone number', binding: 'phone' }
            ]
        }
    });
In the current version supported input Elements are textbox, select, multiselect, date and checkbox:
    { type: 'textbox', label: 'Full Name', binding: 'EmployeeName'},
    { type: 'date', label: 'Start Date', binding: 'sdate' }
    { type: 'checkbox', label: 'Is Active', binding: 'active' },
    { type: 'select', options: [
            {value: 'bg', text: 'Bulgaria'},
            {value: 'ru', text: 'Russia'}],
        label: 'Country', binding: 'country' },
    { type: 'multiSelect', options: [
            { value: 'tag0', text: 'Tag 0' },
            { value: 'tag1', text: 'Tag 1' },
            { value: 'tag2', text: 'Tag 2' },
            { value: 'tag3', text: 'Tag 3' },
            { value: 'tag4', text: 'Tag 4' },
            { value: 'tag5', text: 'Tag 5' },
            { value: 'tag6', text: 'Tag 6' }],
        label: 'Tags', binding: 'tags'
    }
Also you can add validations to the textbox:
{ type: 'textbox', label: 'Email Address', binding: 'Email', vlidators: { required: 'Is required', email: 'Invalid email' } }
Here is how you can configure the Buttons:
    var chart = new OrgChart(document.getElementById("tree"), {
        editForm: {
            buttons:  {
                edit: {
                    icon: OrgChart.icon.edit(24,24,'#fff'),
                    text: 'Edit',
                    hideIfEditMode: true,
                    hideIfDetailsMode: false
                },
                share: {
                    icon: OrgChart.icon.share(24,24,'#fff'),
                    text: 'Share'
                },
                pdf: {
                    icon: OrgChart.icon.pdf(24,24,'#fff'),
                    text: 'Save as PDF'
                },
                remove: {
                    icon: OrgChart.icon.remove(24,24,'#fff'),
                    text: 'Remove',
                    hideIfDetailsMode: true
                }
            }
        }
    });
If you don't need a particular button, you can set it to null.
    var chart = new OrgChart(document.getElementById("tree"), {
        editForm: {
            buttons:  {
                ...
                pdf: null
            }
        }
    });
Set hideIfEditMode to true if you want specified button to be hidden in edit mode, and set hideIfDetailsMode to be hidden in details mode. Built-in buttons with actions are:
- edit: will change the Edit Form to edit mode
- share: is using the native share feature of the device
- pdf: will export the data of the node to A4 pdf document
- remove: deletes the node
You can easelly change the Edit Form color for a template by setting editFormHeaderColor property of the template:
OrgChart.templates.anaOrange.editFormHeaderColor = '#FFCA28';
You can set the text for the "Cancel" and "Save and close" buttons:
    var chart = new OrgChart(document.getElementById("tree"), {
        editForm: {
            cancelBtn: 'Close',
            saveAndCloseBtn: 'Save'
        }
    });
You can change the Edit Form color for a node with CSS and node tags, see the CSS from the demo below or click one of the nodes to see the Edit Form:
Add Your Buttons
In some cases you may want to add more buttons to the Edit Form, for example button that will change the template of the selected node or export to svg or open a new browser tab. The only thing that you will need is an svg image (icon). The demo below demonstrates how to open google maps for a node:
"Add more fields"
To can change the text "Add More Fileds", or to hide it, set addMore, addMoreBtn and addMoreFieldName to what you need or to empty string or null:
    var chart = new OrgChart(document.getElementById("tree"), {
        editForm: {
            addMore: 'Add more elements',
            addMoreBtn: 'Add element',
            addMoreFieldName: 'Element name',
        }
    });
Add Your Elements
Also you can add custom input Elements to Edit From by adding new static method to OrgChart.elements object. In the following demo we will add custom textarea Element to the Edit Form, click JavaScript tab to see the code:
Custom Edit Form
If you dont like our Edit Form you can define your own. The first thing that you have to do is to create javascript class with the following methods:
    var editForm = function () {
        ...
    };

    editForm.prototype.init = function (obj) {
        ...
    };

    editForm.prototype.show = function (node) {
        ...
    };

    editForm.prototype.hide = function (showldUpdateTheNode) {
        ...
    };
Then instantiate the editForm object
    var chart = new chart(document.getElementById("tree"), {
            editUI: new editForm(),
            ...
    });
Here is an example (to see the Edit Form click one the nodes):