Highlight Nodes on Hover in OrgChart JS
The Challenge with Large Org Charts
As organizations grow, their organizational charts become increasingly complex. A company with hundreds or thousands of employees creates a web of reporting relationships that can overwhelm users trying to understand structure and hierarchy.
The core problem? It's difficult to trace the reporting path for any given employee. Users click around trying to understand where someone sits in the hierarchy, who their managers are, and how departments connect. This friction reduces adoption and engagement with your organizational tools.
The Solution: Interactive Hover Highlighting
Hover highlighting transforms the user experience by providing instant visual feedback. When users move their cursor over any node, the application intelligently reveals the complete hierarchical path from that employee up through all managers to the CEO or organizational root.
This simple interaction delivers powerful clarity:
What Happens When You Hover
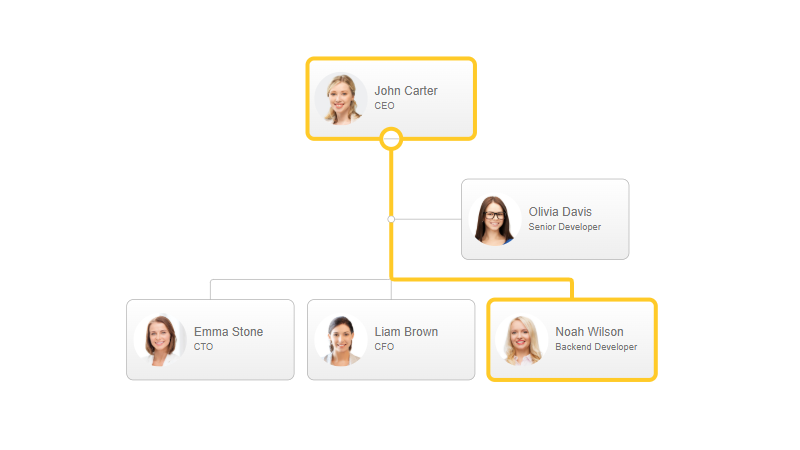
🎯 The Hovered Node Stands Out
The selected employee node becomes visually prominent, drawing immediate attention.
⬆️ Parent Nodes Illuminate
Every manager, director, and executive in the direct reporting chain lights up, showing the complete path to organizational leadership.
🔗 Connection Path Becomes Clear
The lines connecting the employee to all managers visually strengthen, making relationships unmistakable.
🌫️ Context Recedes
Other nodes fade slightly into the background, reducing visual noise and focusing attention where it matters.
Implementation Is Simple
Adding this powerful feature to your OrgChart JS implementation requires just one configuration:
var chart = new OrgChart(document.getElementById("tree"), {
   highlightOnHover: "parents"
});
That's it. No complex styling or event listeners needed. The feature works out of the box with OrgChart's intuitive design.
Why This Matters for Your Users
Faster Navigation – Users answer organizational questions instantly without multiple clicks or searching.
Reduced Cognitive Load – Visual highlighting eliminates the need to mentally trace paths through complex hierarchies.
Better Understanding – New employees quickly grasp reporting structures and departmental relationships.
Improved Accessibility – Visual feedback makes navigation easier for users with different learning styles and abilities.
Professional Polish – Interactive feedback signals a modern, thoughtfully designed application.
Real-World Scenarios Where Hover Highlighting Shines
Employee Onboarding – New hires quickly understand who reports to whom and how their role fits into the organization.
Leadership Navigation – Executives instantly see team composition and chain of command relationships during strategy sessions.
HR Operations – HR professionals efficiently trace reporting lines when managing transfers, promotions, or organizational restructuring.
Cross-Department Collaboration – Team members understand reporting structures in unfamiliar departments, facilitating better collaboration.
Organizational Transparency – Companies building internal portals provide employees with self-service access to organizational insights.
Flexible Highlighting Options
The highlightOnHover option supports multiple highlighting modes, giving you complete control over how relationships are visualized:
Highlight Parent Nodes (Default)
var chart = new OrgChart(document.getElementById("tree"), {
   highlightOnHover: "parents"
});
Shows the complete chain of command upward—perfect for understanding reporting relationships and organizational structure.
Highlight Child Nodes (Direct Reports)
var chart = new OrgChart(document.getElementById("tree"), {
   highlightOnHover: "children"
});
Illuminates all direct reports when hovering over a manager. Ideal for team leaders who need to see their complete team hierarchy at a glance.
Highlight Same Level Nodes (sameLevel)
var chart = new OrgChart(document.getElementById("tree"), {
   highlightOnHover: "sameLevel"
});
Highlights peers and colleagues at the same organizational level. Perfect for understanding lateral relationships, identifying peer groups, and visualizing departmental structures.
Choose What Works for Your Use Case
Each highlighting mode serves different purposes:
- parents – Best for showing who is in charge and understanding chain of command
- children – Best for team composition and direct report visibility
- sameLevel – Best for peer relationships and organizational alignment
You can also combine these modes or create custom patterns to match your specific organizational needs and user workflows.
Get Started Today
Transform your organizational charts from static diagrams into interactive, user-friendly tools. Learn more about the highlightOnHover feature and explore additional configuration options to perfect your implementation.
Your users will appreciate the clarity. Your adoption metrics will show the difference.